导语:随着大数据的发展,数据可视化成了我们日常开发中普遍存在的一种需求。现在我就日常工作过程中的可视化开发总结一下,回顾一下,本篇使用百度开源的echarts库来做案例。
# echarts资源
echarts Github (opens new window)
# 下载并引入echarts
- 下载echarts
npm install echarts -S
1
- 全局引入
在src下面的main.js中引入echarts,并全局使用。
// 引入echarts
import echarts from 'echarts'
// 挂载到vue原型
Vue.prototype.$echarts = echarts;
1
2
3
4
2
3
4
# 使用cdn
可以在index.html里面head标签中加一个script标签,使用bootcss的cdn。
// 国内的cdn
<script src="https://cdn.bootcss.com/echarts/4.2.1-rc1/echarts.min.js"></script>
// 国外的npm的
<script src="https://unpkg.com/echarts@4.2.1/index.js"></script>
1
2
3
4
2
3
4
# 简单案例
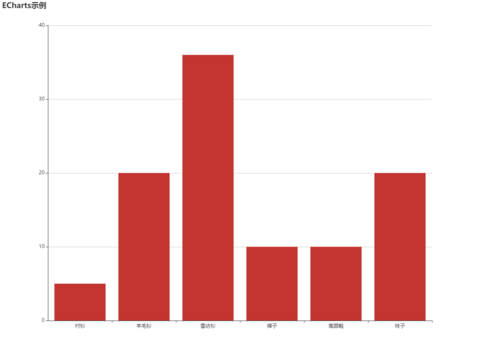
引入一个简单的柱状图,在你的组件中写入以下代码。
- template模板
<div id="myeg"></div>
1
- scripts
data () {
  return {
    option: {
      title: {
          text: 'ECharts示例'
      },
      tooltip: {},
      xAxis: {
          data: ['衬衫', '羊毛衫', '雪纺衫', '裤子', '高跟鞋', '袜子']
      },
      yAxis: {},
      series: [{
          name: '销量',
          type: 'bar',
          data: [5, 20, 36, 10, 10, 20]
      }]
    },
  }
}
var myChartEg = this.$echarts.init(document.getElementById('myeg'));
// 绘制图表
myChartEg.setOption(this.option);
window.addEventListener("resize",function(){
    myChartEg.resize();
});
1
2
3
4
5
6
7
8
9
10
11
12
13
14
15
16
17
18
19
20
21
22
23
24
25
2
3
4
5
6
7
8
9
10
11
12
13
14
15
16
17
18
19
20
21
22
23
24
25
# 预览
# 更多示例
更多示例请访问echarts Demo (opens new window)
# 补充
除了echarts,还要其他比较优秀的可视化库可以使用。


